
Troubleshooting Native Memory Leaks in Java Applications
We all have seen variants of the following errors at least once while working with Java applications:
# A fatal error has been detected by the Java Runtime Environment:
#
# java.lang.OutOfMemoryError : unable to create new native Thread
# A fatal error has been detected by the Java Runtime Environment:
#
# java.lang.OutOfMemoryError: requested 32756 bytes for ChunkPool::allocate. Out of swap space?
#
#  Internal Error (allocation.cpp:166), pid=2290, tid=27 #  Error: ChunkPool::allocate
Well, what do these errors mean? Are they related to my Java Heap running out of memory?
Native OutOfMemoryError
The above two errors indicate that the JVM has run out of native memory resources. In the first case, the JVM failed to create a new native thread, and in the second, an internal JVM class ChunkPool could not allocate memory, and thus the JVM failed with an OutOfMemoryError.
The JVM reports a native out-of-memory error when it is not able to allocate from native memory that is not managed by the JVM. The reason behind that could be that our Java application or other applications running on the system might be exhausting native memory resources. To circumvent this, we could try making more room available for native allocations by reducing the size of Java heap, Metaspace, number of threads and their stack sizes, and even terminating other processes on the system that are not needed. If all of these measures don’t help resolve native memory-related errors, then in that case, we might be facing a native memory leak. The objective of this blog post is to discuss native memory leaks, and how we can detect and troubleshoot them. The Java examples that I will be using in this post are available here: https://github.com/poonamparhar/native_leaks.
Memory Pools
Let’s first talk about different memory pools that a Java application has access to and can allocate from. As we all know, java objects are allocated into the Java Heap. Besides the Java Heap, there are other JVM managed memory spaces such as Metaspace and Codecache. In addition, the JVM and the native code of applications can make allocations out of native memory. These native allocations can come from several different places - JNI allocations, allocations made by the JIT compiler, or creation of new threads by the JVM.
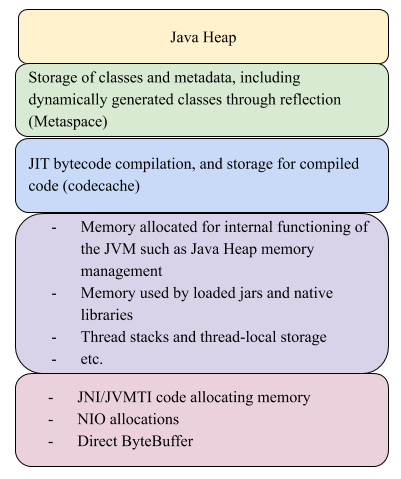
The figure above shows various memory pools available in a Java application. The top one is the Java Heap where java objects are allocated. The second one represents Metaspace which is the storage for classes and their metadata. After that, there is CodeCache where the just-in-time compilers store the compiled code. The next block shows different kinds of native memory allocations that the JVM can perform, including allocations for internal structures, loaded jars and native libraries, thread stacks and so on. Additionally, Java applications can have JNI or JVMTI code making allocations from native memory. NIO and Direct ByteBuffer also make native memory allocations. The fact that native allocations can come from several different places makes it very hard to detect and diagnose native memory related problems.
Confirm Native Memory Leak
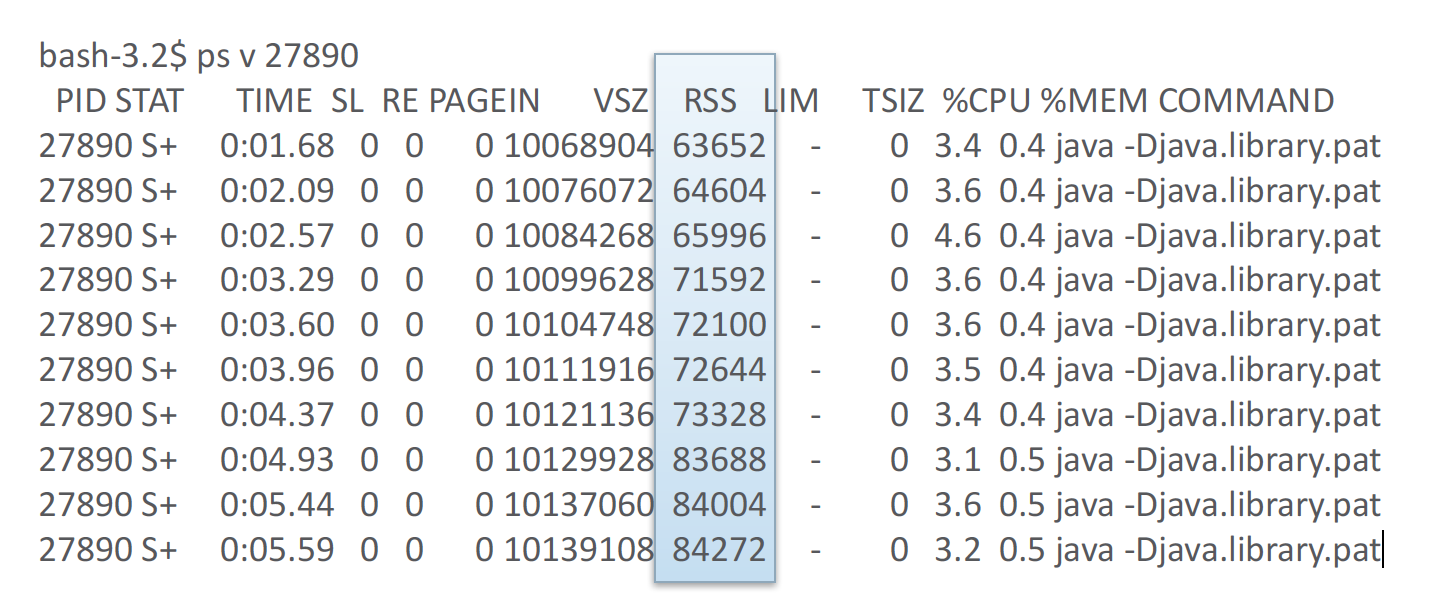
The first step in detecting memory leaks is to monitor the memory usage of our application to confirm if there is any growth at all in the overall memory utilization. On unix based systems, we can use tools like ps, top, and pmap to monitor memory. The following screenshot shows the memory utilization (note RSS - the 7th blue marked column) of the monitored process growing over time.
RSS though may not be a reliable way to measure the process size accurately. There is a known issue that RSS does not report the memory size of a process correctly if the process uses multi-mapping i.e. it maps multiple ranges of the virtual memory to the same range in the physical memory. Note that the ZGC collector of the JVM uses multi-mapping, so RSS won’t report the correct memory size of the process running with ZGC. We should use PSS instead!
PSS stands for Proportional Set Size, and accounts for the used shared and the private memory separately. It calculates the memory footprint of a process as:
Private Physical Memory + Shared Physical Memory / Number of Mappers
We can obtain the PSS details of a process from its /proc/
$ cat print_pss.sh

pid=$1
echo 'Monitoring PSS of the Process:' $pid
while true
do
  cat /proc/$pid/smaps | grep -i 'Pss:' |  awk '{Total+=$2} END {print "PSS: " Total}'
  sleep 5
done
$ sh print_pss.sh 27890

Monitoring PSS of the Process: 27890
PSS: 46482
PSS: 47638
PSS: 48582
PSS: 50406
PSS: 51333
PSS: 52602
PSS: 53557
PSS: 54278
PSS: 55038
PSS: 55622
The above shows the total physical memory usage of the process growing over time.
The next step is to determine if the memory growth is coming from any of the Heap or Non-Heap regions of the JVM. This can be done using tools like JConsole or JMC. Force garbage collections to ensure that the JVM gets a chance to collect the unreachable java objects in the Java Heap and also reclaim their associated native memory resources.
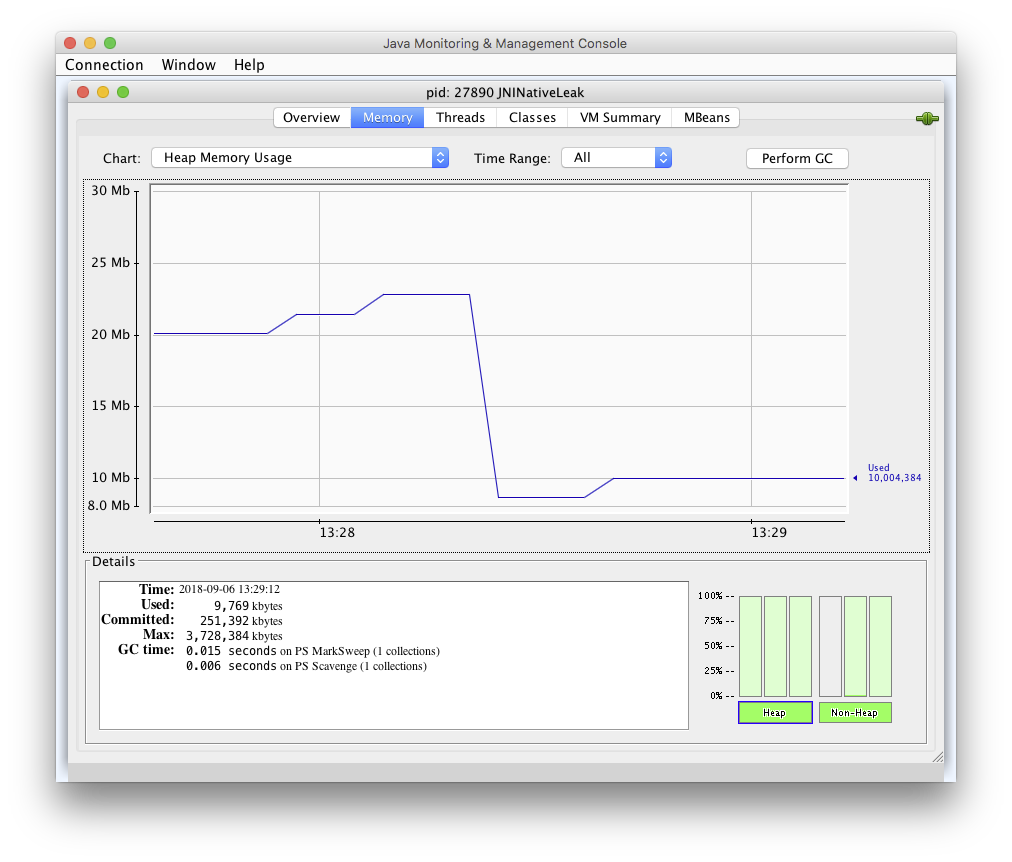
As seen in the above snapshot, if we don’t find any evidence of memory growth in the JVM managed memory regions, it means that allocations outside the JVM are responsible for the process memory growth. In such cases, it is often helpful to find the growing memory sections of our process. For that, we can use tools like pmap, and compare its periodically collected output to determine which memory sections are growing in size, or which ones are newly allocated.
$ diff pmap.1 pmap.9
12a13,14
> 00007f4060000000 32276K rw--- [ anon ]
> 00007f4061f85000 33260K ----- [ anon ]
56,57c58
< 00007f40a4000000 18952K rw--- [ anon ]
---
> 00007f40a4000000 65536K rw--- [ anon ]
146c147
< total 3222140K
---
> total 3287676K


$ diff pmap.2 pmap.9
12a13,14
> 00007f4060000000 32276K rw--- [ anon ]
> 00007f4061f85000 33260K ----- [ anon ]
56,57c58
< 00007f40a4000000 25600K rw--- [ anon ]
---
> 00007f40a4000000 65536K rw--- [ anon ]
146c147
< total 3222140K
---
> total 3287676K
Similarly for Windows, PerfMon or VMMap are helpful in tracking memory usage.
Once we have figured that there is a growth in memory usage over time, and that growth is not coming from the Java Heap, we are most likely facing a native memory leak.
Diagnose Native Memory Leaks
As mentioned above, native memory leaks can be due to native allocations done internally by the JVM, or from outside the JVM. Let’s see how we can diagnose both kinds of these memory leaks.
1. Native Memory Leaks Within the JVM
The JVM has a powerful tool called Native Memory Tracking (NMT) that can be used to track native memory allocations done internally by the JVM. Note that this tool cannot track native memory allocated outside of the JVM, for instance by JNI code.
Here’s how this tool can be used:
- Launch the Java process to be monitored with NMT enabled using the JVM option NativeMemoryTracking. The output level of the NMT tracking can be set to a ‘summary’ or ‘detail’ level as shown below:
  -XX:NativeMemoryTracking=summary
  -XX:NativeMemoryTracking=detail
- Now jcmd tool can be used against the NMT enabled process to get its native memory usage details. It is also possible to collect a baseline of memory usage and then collect the difference in usage against that baseline.
  jcmd  VM.native_memory
  jcmd  VM.native_memory baseline
  jcmd  VM.native_memory detail.diff/summary.diff
Enabling NMT can result in a 5 to 10 percent JVM performance drop. Therefore it should be enabled in production systems cautiously. Also, the native memory used by NMT is tracked by the tool itself.
The JConsole snapshot below shows that the Memory Pool ‘Compressed Class Space’ is growing at a constant rate over time.
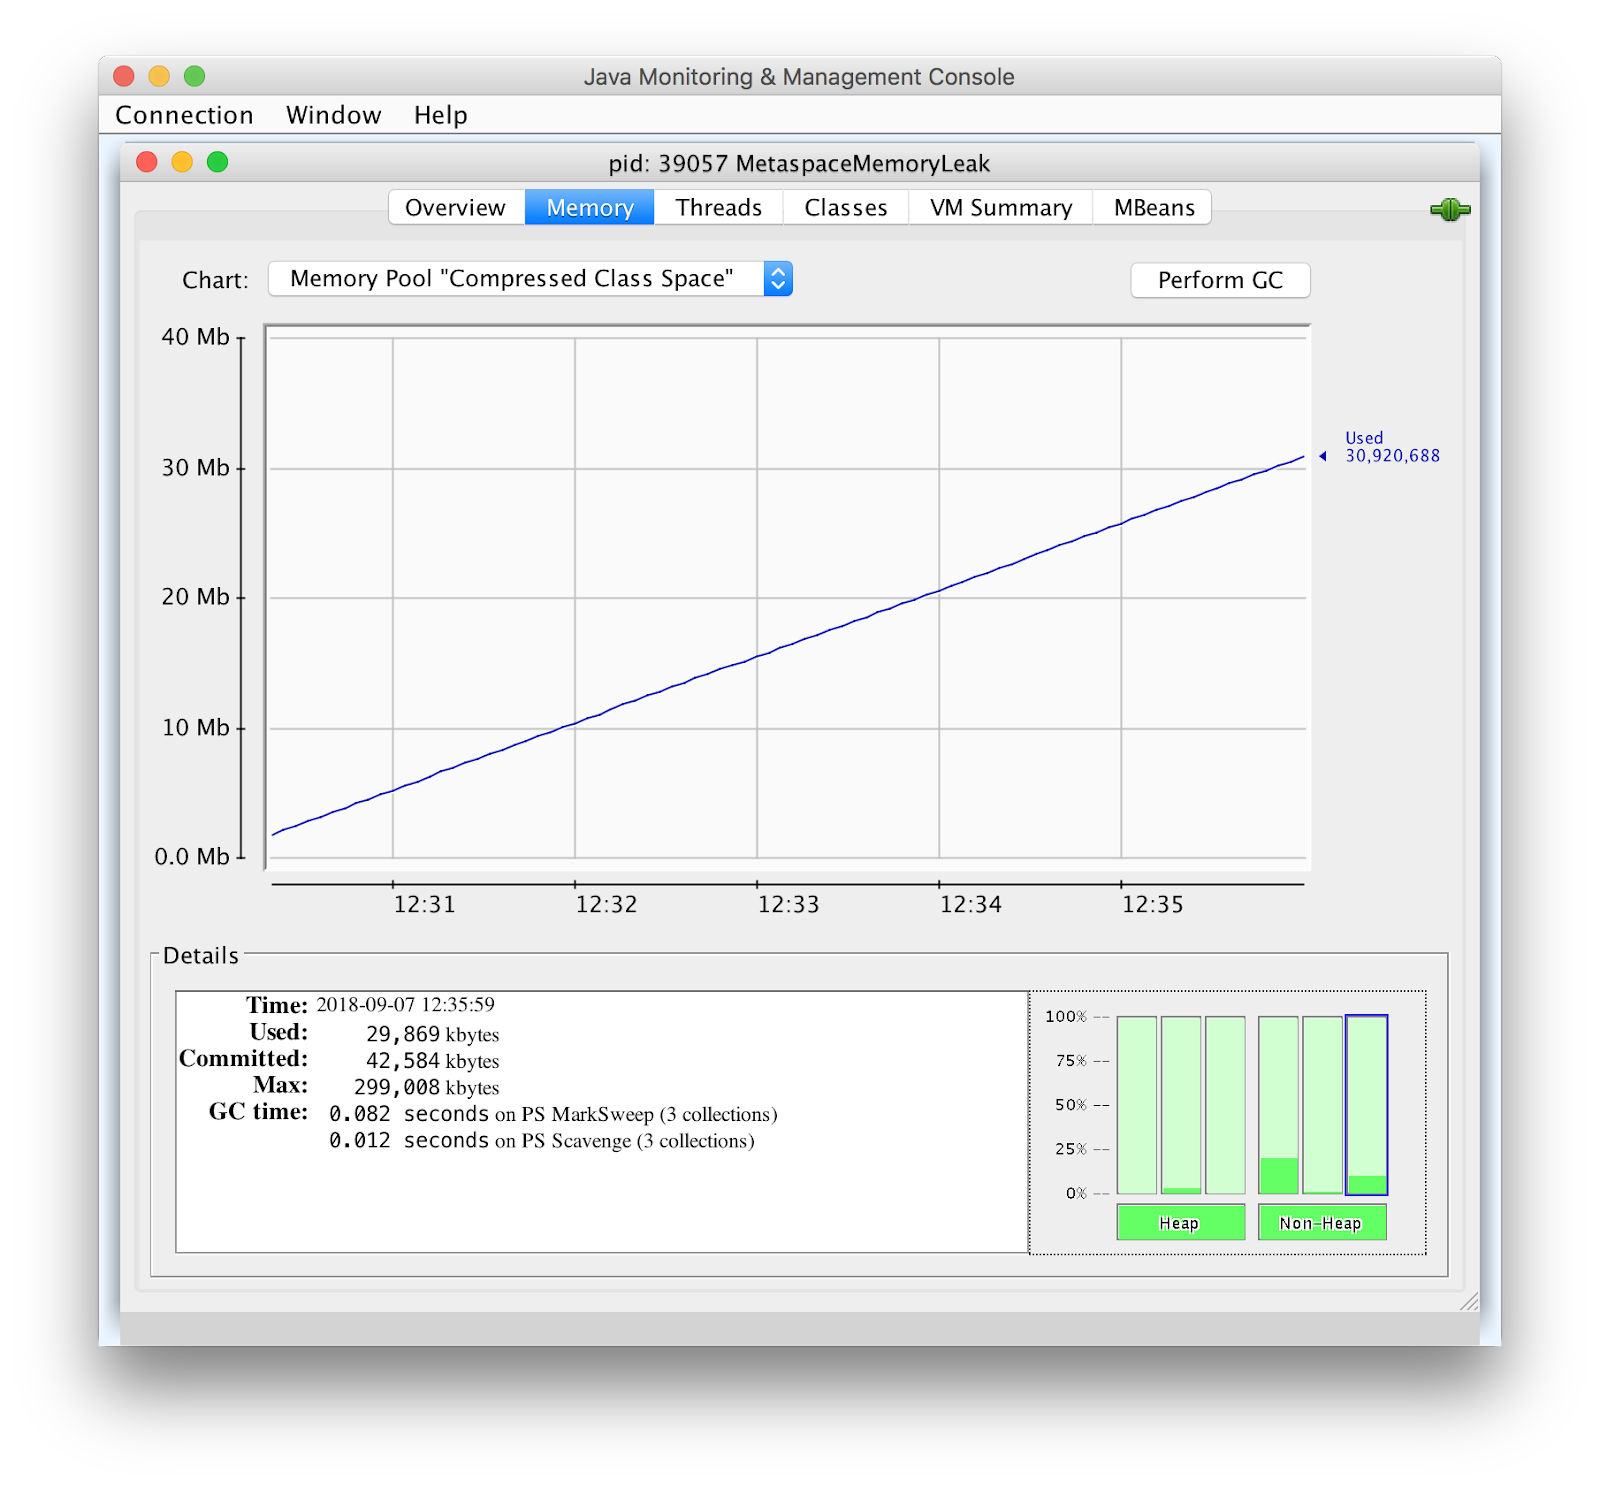
We can track it using the NMT. Collecting a baseline and a summary.diff below shows that the classes memory space usage is increasing dramatically due to the increase in the number of loaded classes.
bash-3.2$ jcmd 39057 VM.native_memory summary.diff
39057:
Native Memory Tracking:
Total: reserved=5761678KB +52943KB, committed=472350KB +104143KB
-           Java Heap (reserved=4194304KB, committed=163328KB +7680KB)
                            (mmap: reserved=4194304KB, committed=163328KB +7680KB)

-              Class (reserved=1118333KB +47579KB, committed=117949KB +89963KB)
                  (classes #68532 +58527)
                  (malloc=8317KB +2523KB #5461 +3371)
                  (mmap: reserved=1110016KB +45056KB, committed=109632KB +87440KB)

-              Thread (reserved=21594KB -2057KB, committed=21594KB -2057KB)
                   (thread #22 -2)
                   (stack: reserved=21504KB -2048KB, committed=21504KB -2048KB)
                   (malloc=65KB -6KB #111 -10)
                   (arena=25KB -2 #42 -4)

-              Code (reserved=250400KB +244KB, committed=5612KB +1348KB)
                   (malloc=800KB +244KB #1498 +234)
                   (mmap: reserved=249600KB, committed=4812KB +1104KB)

-              GC (reserved=159039KB +18KB, committed=145859KB +50KB)
                   (malloc=5795KB +18KB #856 +590)
                   (mmap: reserved=153244KB, committed=140064KB +32KB)

-              Compiler (reserved=153KB, committed=153KB)
                   (malloc=22KB #72 -2)
                   (arena=131KB #3)

-              Internal (reserved=13537KB +6949KB, committed=13537KB +6949KB)
                    (malloc=13505KB +6949KB #70630 +59119)
                    (mmap: reserved=32KB, committed=32KB)

-              Symbol (reserved=2715KB +9KB, committed=2715KB +9KB)
                     (malloc=1461KB +9KB #702 +29)
                     (arena=1255KB #1)

-       Native Memory Tracking (reserved=1416KB +1031KB, committed=1416KB +1031KB)
                      (malloc=140KB +34KB #2197 +518)
                      (tracking overhead=1275KB +997KB)

-               Arena Chunk (reserved=186KB -832KB, committed=186KB -832KB)
                            (malloc=186KB -832KB)
2. Native Memory Leaks from Outside the JVM
For native memory leaks stemming from outside the JVM, we can use platform native and other third party tools for their detection and troubleshooting. Following is the list of tools that are helpful in pinpointing native memory leaks coming from allocations done outside the JVM:
- jemalloc
- Valgrind
- dbx on Solaris
- Purify available on both Unix platforms and Windows
- User-Mode Dump Heap (UMDH) on Windows
- Core files
Let’s take a closer look at some of these tools.
jemalloc
jemalloc is a memory allocator and a profiler. It has its own implementation of malloc, and has a built-in allocation profiler that can trace the allocations made with malloc. Moreover, it has very low performance impact because it traces samples of allocations, so can be safely used in production systems. The performance impact can be limited to about 2% for an application using malloc heavily. jemalloc can be downloaded from: https://github.com/jemalloc/jemalloc
Build jemalloc
We can use configure and make to build jemalloc. Make sure to use –enable-prof in order to enable memory profiling in the resultant binary.
$ configure --prefix=/usr/local --enable-prof
$ make
Create memory profiles
For generating memory profiles of our Java application, we just need to set MALLOC_CONF env variable informing the tool how we would like to sample allocations and save heap profiles on the disk. An example below shows how jemalloc can be used with a Java application TestDeflater. With this configuration, jemalloc collects allocation samples after every 2MB (2^21) of allocations, and creates a profile dump after every 1GB (2^30) of allocations.
$ export JEMALLOC_PATH=/user/home/poonam/jemalloc-5.1.0
$ export MALLOC_CONF=prof:true,lg_prof_interval:30,lg_prof_sample:21
$ LD_PRELOAD=${JEMALLOC_PATH}/lib/libjemalloc.so.2 java -Xmx1024m -Xms1024m -XX:MaxNewSize=20m TestDeflater
The page here http://jemalloc.net/jemalloc.3.html shares detailed information on all the various options that can be used with this tool.
Display memory allocations using jeprof
The previous step created memory profiles (files with names jeprof*.heap) on the disk. Information in these profiles can be displayed using the jeprof tool that is part of jemalloc. We can use –show_bytes to display memory allocations in a textual or graphical format.
$ jeprof --show_bytes `which java` jeprof.23299.0.f.heap
(jeprof) top
Total: 341324080 B
325433344  95.3%  95.3% 325433344  95.3% deflateInit2_
15292392   4.5%  99.8% 15292392   4.5% os::malloc@926750
  368704   0.1%  99.9%   368704   0.1% readCEN
  116448   0.0% 100.0% 325549792  95.4% Java_java_util_zip_Deflater_init
   81920   0.0% 100.0%    81920   0.0% std::__once_callable
   12016   0.0% 100.0%    12016   0.0% _dl_new_object
    3840   0.0% 100.0%     3840   0.0% allocate_dtv
    3616   0.0% 100.0%     3616   0.0% _nl_intern_locale_data
    2048   0.0% 100.0%     2208   0.0% __tzfile_read
    1984   0.0% 100.0%     1984   0.0% _dl_check_map_versions
The first column here shows the total memory being used in bytes by the function printed in the last column. The fourth column is the memory used by the respective function and all of its callees. The second and fifth columns are the percentage representations of the numbers in the first and fourth columns respectively. And the third column is a cumulative sum of the second column i.e. the kth entry in the third column is the sum of the first k entries in the second column.
We can also visualize the above information in a graphical format using –gif option.
jeprof --show_bytes --gif `which java` jeprof.23299.0.f.heap > leak.gif
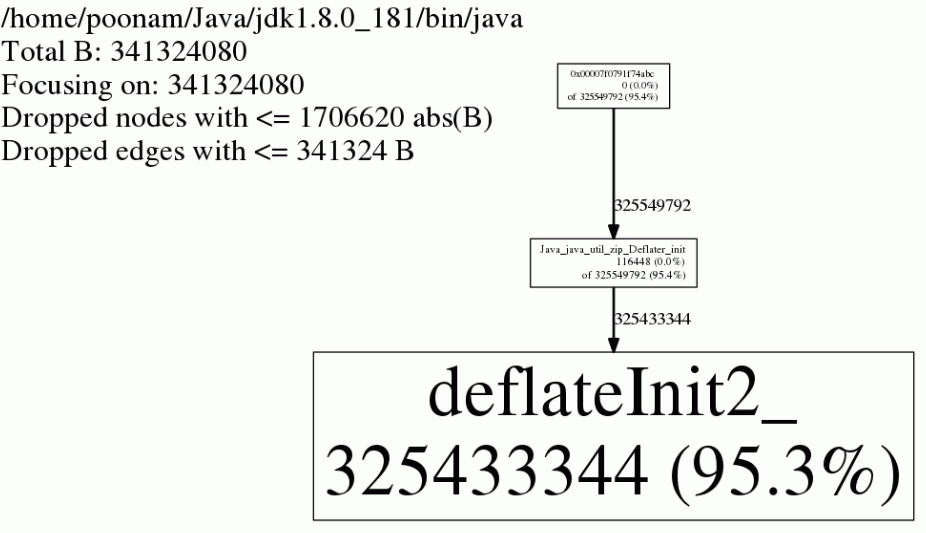
Dbx
jemalloc requires libunwind to print the stack traces for allocations, which is not available on the Sparc platform. On Sparc, we can use the Sun Studio dbx to debug native memory leaks. Here are the steps that can be followed:
$ export LD_AUDIT=<Path to Sun Studio>/lib/dbx/sparcv9/runtime/rtcaudit.so
$ export PATH=<Path to Sun Studio>/bin/sparcv9/:$PATH
$ java -Xmx1024m -Xms1024m -XX:MaxNewSize=20m TestDeflater &
$ dbx `which java` <pid of TestDeflater process>

> check -leaks

> showleaks

Actual leaks report    (actual leaks: 891   total size: 15174608 bytes)

    Total       Num of   Leaked     Allocation call stack  Size      Blocks     Block     Address
=================================================================
   3735552      57      -      zcalloc < deflateInit2_ <Java_java_util_zip_Deflater_init < 0xffffffff6941191c< 0xffffffff694118c0<0xffffffff69407c28< 0xffffffff69408068< 0xffffffff69408068
   3670016      56      -      zcalloc < deflateInit2_
   3670016      56      -      zcalloc < deflateInit2_
   3604480      55      -      zcalloc < deflateInit2_
    339264      57      -      zcalloc < deflateInit2_
     65536       2      -      zcalloc < updatewindow < inflate
As we can see above, showleaks shows the top leaking blocks and correctly identifies that allocations from Java_java_util_zip_Deflater_init() are leaking. If dbx throws any error while attaching to the process, unset LD_AUDIT environment variable after launching the java process and before attaching dbx to it.
Valgrind
On Linux platform, I also used Valgrind with the example TestDeflater Java program.
$ valgrind --leak-check=full --show-leak-kinds=all --suppressions=suppression_file --log-file=valgrind_full_suppression.log -v java TestDeflater
Please note that I am providing a suppression file to valgrind so that it does not consider the JVM internal allocations such as Java Heap allocation as potential memory leaks otherwise it becomes very hard to parse through the output and then manually filter those out.
Contents of the suppression file:
{
   name
   Memcheck:Leak
   fun:*alloc
   ...
   obj:/home/poonam/Java/jdk1.8.0_181/jre/lib/amd64/server/libjvm.so
   ...
}
With suppressions in place, I could see several leaks reported with the following stack trace:
==5200== 88 bytes in 1 blocks are still reachable in loss record 461 of 18,861
==5200==    at 0x4C2FB55: calloc (in /usr/lib/valgrind/vgpreload_memcheck-amd64-linux.so)
==5200==    by 0x7DCB156: Java_java_util_zip_Deflater_init (in /home/poonam/Java/jdk1.8.0_181/jre/lib/amd64/libzip.so)
==5200==    by 0x80F54FC: ???
==5200==    by 0x8105F87: ???
==5200==    by 0xFFFFFFFE: ???
==5200==    by 0xEC67F74F: ???
==5200==    by 0xC241B03F: ???
==5200==    by 0xEC67D767: ???
==5200==    by 0x413F96F: ???
==5200==    by 0x8101E7B: ???
==5200==
==5200== 88 bytes in 1 blocks are still reachable in loss record 462 of 18,861
==5200==    at 0x4C2FB55: calloc (in /usr/lib/valgrind/vgpreload_memcheck-amd64-linux.so)
==5200==    by 0x7DCB156: Java_java_util_zip_Deflater_init (in /home/poonam/Java/jdk1.8.0_181/jre/lib/amd64/libzip.so)
==5200==    by 0x80F54FC: ???
==5200==    by 0x8105F87: ???
==5200==    by 0xFFFFFFFE: ???
==5200==    by 0xEC67FF3F: ???
==5200==    by 0xC241B03F: ???
==5200==    by 0xEC630EB7: ???
==5200==    by 0x413F96F: ???
==5200==    by 0x8101E7B: ???
==5200==    by 0x41: ???
==5200==    by 0x19EAE47F: ???
Thus, valgrind could successfully identify the cause of memory leak in our example test program. However, I observed that using valgrind impacted the application performance significantly; making it somewhere around 20 to 30 times slower. Therefore it might not be feasible to use valgrind effectively in production environments.
Core files
As we saw earlier, pmap output can prove to be helpful in identifying the memory blocks that are changing in size over time. With core files, we can view the contents of those memory blocks and see if we can recognize what’s present there and then link it back to our code. I am using the JNINativeLeak example for the illustrations below.
$ diff pmap.15767.1 pmap.15767.3
69,70c69,70
< 00007f6d68000000 17036K rw--- [ anon ]
< 00007f6d690a3000 48500K ----- [ anon ]
---
> 00007f6d68000000 63816K rw--- [ anon ]
> 00007f6d6be52000 1720K ----- [ anon ]
From the pmap output above, we can see that the memory block at 00007f6d690a3000 is changing and growing between the two snapshots. With a core file collected from the process, we can examine the contents of this memory block.
$ gdb `which java` core.15767
GNU gdb (Ubuntu 7.11.1-0ubuntu1~16.5) 7.11.1
Copyright (C) 2016 Free Software Foundation, Inc.
...
(gdb) x/100s 0x00007f6d690a3000
0x7f6d690a3000: "mory Leak "
0x7f6d690a300c: "Alert: JNI Memory Leak "
0x7f6d690a3025: "Alert: JNI Memory Leak "
0x7f6d690a303e: "Alert: JNI Memory Leak "
0x7f6d690a3057: "Alert: JNI Memory Leak "
0x7f6d690a3070: "Alert: JNI Memory Leak "
Aha! We have found a repeating string “Alert: JNI Memory Leak “ at that memory block, and can now search for it in the source code. And that leads us to the culprit.
JNIEXPORT void JNICALL Java_JNINativeLeak_allocateMemory
(JNIEnv *env, jobject obj, jint size) {
    char* bytes = (char*) malloc(size);
    printf("Allocated %d bytes at %p \n", size, (void*)bytes);
    for (int i=0; i<40; i++) {
        strcpy(bytes+i*25, "Alert: JNI Memory Leak ");
    }
}
Summary
To summarize, the following steps can guide us through the troubleshooting of native memory leaks:
- Monitor the overall memory usage of the process using native tools such as ps, top and pmap.
- Determine whether the memory growth is in the non-Heap regions of the JVM, or in the areas outside the JVM using the JConsole or JMC.
- Force garbage collections and confirm that there is a native memory leak.
- For identifying native leaks from inside the JVM, use NMT.
- For identifying native leaks stemming from outside of the JVM, we can use jemalloc, valgrind, dbx, purify, UMDH, pmap and core files.