
UseDynamicNumberOfCompilerThreads and Memory Footprint
UseDynamicNumberOfCompilerThreads is a JVM option that controls the dynamic number of compiler threads used by the Java HotSpot JVM’s Just-In-Time (JIT) compiler to compile Java bytecode into optimized machine code.
When this option is enabled, the HotSpot JVM dynamically adjusts the number of compiler threads based on the workload of the application. This means that the JVM will automatically allocate more threads when there are many methods to compile, and fewer threads when there are fewer methods to compile. UseDynamicNumberOfCompilerThreads is enabled by default in JDK 11 and later versions.
This option can be very useful in improving the performance of Java applications by maximizing the utilization of the available CPU resources. However, for certain workloads, the dynamic creation and termination of compiler threads can cause unexpected retention of memory allocated by the GLIBC allocator, and can lead to increase in Resident Set Size (RSS) of the process.
In this post, I will go over how to identify and diagnose this problem. I’ll also discuss potential workarounds and solutions for this problem.
Monitoring RSS
Let’s start by looking at how we can monitor the RSS of a Java process. On Linux systems, we can use tools such as ps, top, pmap and /proc/<pid>/smaps file to monitor RSS. For example, the following script reads the smaps file for a given process id, and prints the RSS every 5 seconds along with the current timestamp to an output file.
#!/bin/bash

pid=$1
smaps_file=/proc/$pid/smaps
output_file=rss_$pid.out
rm rss_$pid.out

echo 'Monitoring RSS of the Process' $pid. Saving output to file $output_file.

while true
do
  # Get the current timestamp
  timestamp=$(date +"%FT%T%z")
  # Get the current RSS value
  rss=$(grep -m 1 "^Rss:" "$smaps_file" | awk '{print $2}')
  # write timestamp and rss to the output file
  echo "$timestamp: $rss" >> "$output_file"
  sleep 5
done
Increased RSS with +UseDynamicNumberOfCompilerThreads
A significant increase in RSS may be observed when the JVM JIT compiler receives bursts of compilation requests leading to repeated creation and termination of compiler threads. We can trace the dynamic creation and termination of compiler threads using the TraceCompilerThreads JVM option. It is a diagnostic option and needs to be used along with -XX:+UnlockDiagnosticVMOptions.
$ java -XX:+UnlockDiagnosticVMOptions -XX:+TraceCompilerThreads <java program>
...
Added compiler thread C2 CompilerThread2 (available memory: 1266MB, available non-profiled code cache: 114MB)
Added compiler thread C2 CompilerThread3 (available memory: 1266MB, available non-profiled code cache: 114MB)
Removing compiler thread C2 CompilerThread3 after 171 ms idle time
Removing compiler thread C2 CompilerThread2 after 364 ms idle time
Removing compiler thread C2 CompilerThread1 after 166 ms idle time
Added compiler thread C2 CompilerThread1 (available memory: 1086MB, available non-profiled code cache: 113MB)
Added compiler thread C2 CompilerThread2 (available memory: 1086MB, available non-profiled code cache: 113MB)
Added compiler thread C2 CompilerThread3 (available memory: 1086MB, available non-profiled code cache: 113MB)
...
This behavior can be reproduced with the jython benchmark of the DaCapo Benchmark suite. Running that benchmark with and without dynamic compiler threads shows the following trend in the Resident Set Size of the two runs.
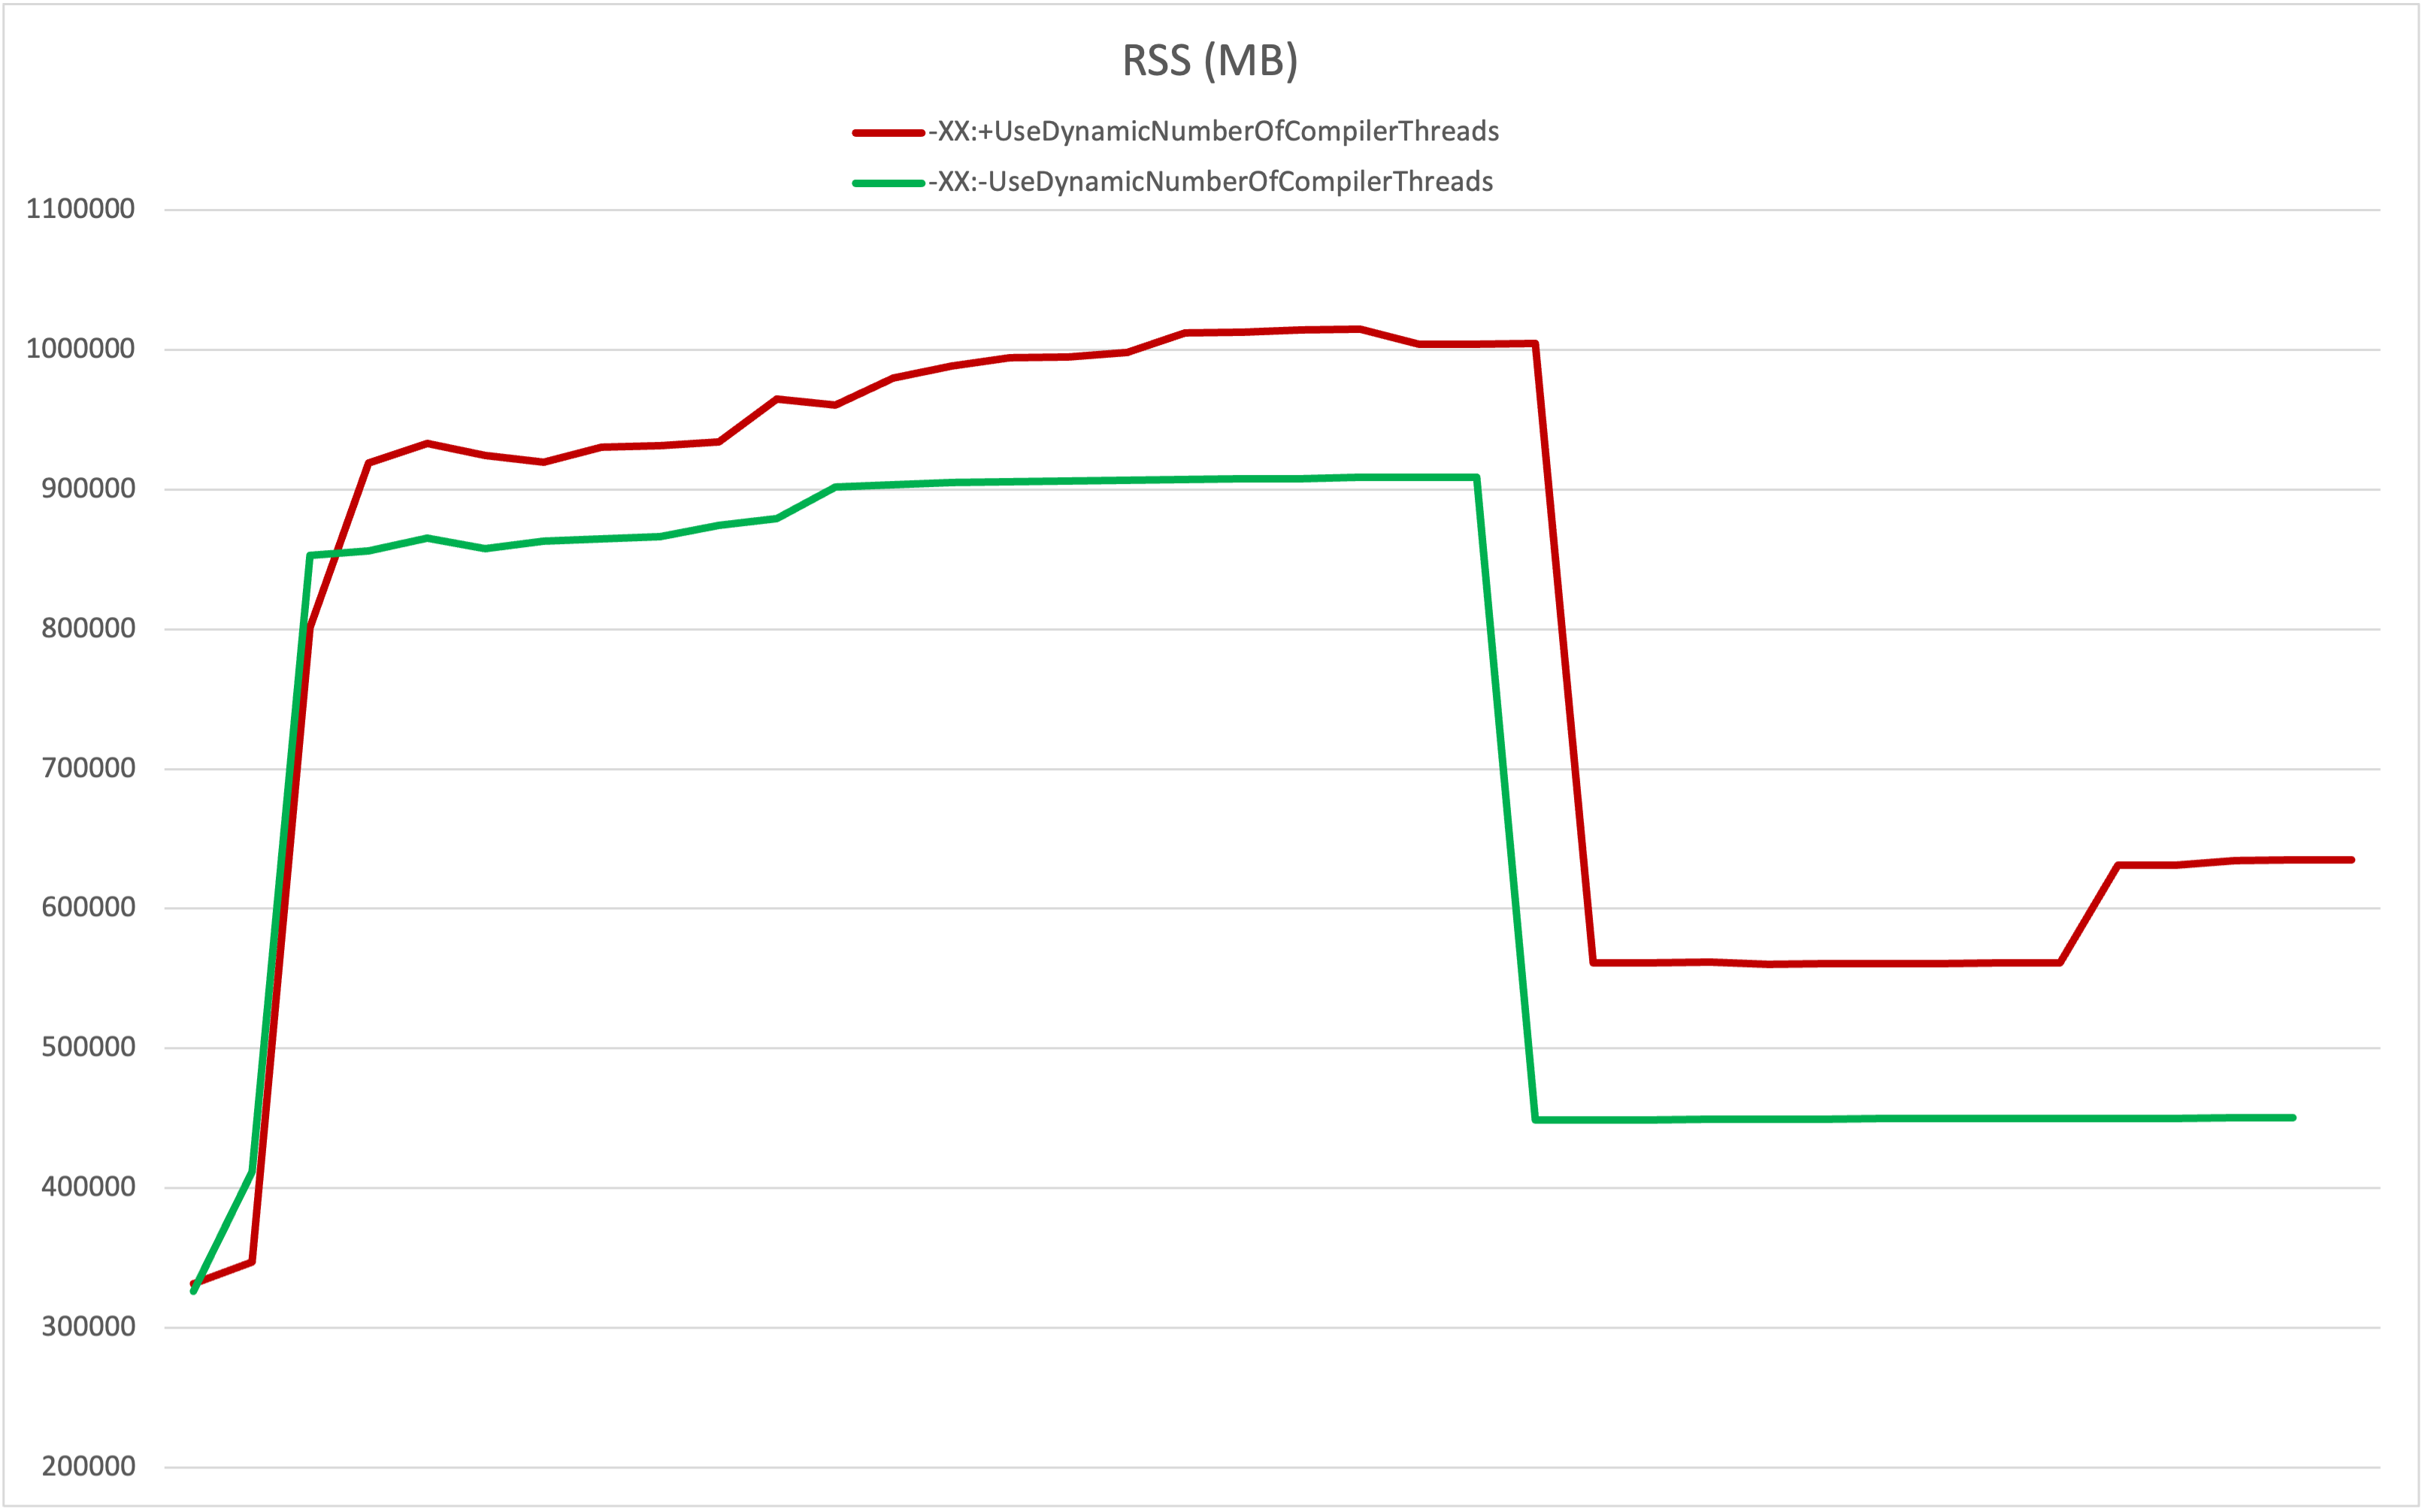
As we can see, the resident set size of the process running with -XX:+UseDynamicNumberOfCompilerThreads is a bit higher than the one running without it.
Why this RSS bloat?
GLIBC uses multiple memory pools called arenas from which the allocation requests made with malloc() are satisfied. With its per-thread malloc arena feature, GLIBC attempts to use a new arena for each thread if one can be created in order to reduce contention and improve multi-threaded allocation performance.
However, this comes with a cost: additional memory usage. Using multiple arenas for different threads can cause memory fragmentation and longer retention of memory by GLIBC’s allocator even after it has been deallocated using free().
Now, how does this relate to UseDynamicNumberOfCompilerThreads? With the UseDynamicNumberOfCompilerThreads option enabled, the JVM can create and terminate compiler threads on demand as the compilation requests in the JIT compiler’s queue rise and fall. These dynamic compiler threads can cause an application to use a large number of different arenas causing malloc fragmentation and excessive memory retention.
You can read the per-thread malloc arena issue described in detail in this glibc bug report.
Workarounds and Solutions
Here are a few workarounds and solutions that can be used to circumvent this RSS increase issue.
1. -XX:-UseDynamicNumberOfCompilerThreads
We can disable the dynamic number of compiler threads feature with -XX:-UseDynamicNumberOfCompilerThreads.
2. -XX:+UnlockDiagnosticVMOptions -XX:-ReduceNumberOfCompilerThreads
Another workaround is to switch off the diagnostic flag ReduceNumberOfCompilerThreads using -XX:+UnlockDiagnosticVMOptions -XX:-ReduceNumberOfCompilerThreads. With this, the JVM starts with a small number of compiler threads and creates more if needed, but never reduces them.
3. Malloc Tunables
GLIBC provides some tuning knobs for the memory allocator. In particular, there is MALLOC_ARENA_MAX environment variable that controls the maximum number of arenas that can be created. A smaller number of arenas may mean more thread contention, while a larger number may result in an increased memory footprint. The default number for MALLOC_ARENA_MAX is calculated dynamically based on the number of CPUs: (num of CPUs * 8) on a 64-bit system. For a machine with a large number of CPUs, the potential maximum number of arenas can be very high. Setting MALLOC_ARENA_MAX to a lower value (for example, 2) can help in limit fragmentation, and prevent an unwanted increase in RSS.
GLIBC malloc environment variables can also be to set using its allocation tunables. More info here: https://www.gnu.org/software/libc/manual/html_node/Memory-Allocation-Tunables.html.
4. malloc_trim()
GLIBC’s malloc_trim() function can be used to release free memory from the native heap back to the operating system. For a Java process, we can use ‘jcmd’ diagnostic command ‘System.trim_native_heap’ to trigger a malloc_trim() call inside the JVM when using GLIBC. The following example shows how this command can be used.
jcmd <process id> System.trim_native_heap
It is important to note that malloc_trim() is an expensive call and its excessive or unnecessary use can impact performance, so use it cautiously considering the trade-offs based on your specific use case.
Summary
With certain workloads, enabling UseDynamicNumberOfCompilerThreads can end up creating a large number of per-thread memory arenas resulting in an undesirable increase in memory footprint for a Java process. This behavior can be controlled by either using -XX:-UseDynamicNumberOfCompilerThreads or -XX:-ReduceNumberOfCompilerThreads, or by lowering the maximum number of malloc arenas, or by invoking ‘jcmd System.trim_native_heap’ periodically against your Java application. Please note that all of these solutions might have some impact on your application performance.